12 Performance Metrics To Level Up Your Software Development Team

Whatever the business or project, it’s likely that performance metrics will play a key role in its success. After all, how can you ensure a project is on track or make improvements to processes if you aren’t measuring what is being done?
Of course, the final verdict on whether any software project is a “success” will depend on a huge number of factors, some of which will be external to your organization’s control. However, performance metrics can be used to track how efficient and effective your development team is at delivering what clients want. They can identify areas of weakness in the development environment that could be undermining overall business performance. And they can drive incremental improvements in internal processes that should ultimately lead to higher levels of client satisfaction.
Make Your Measurements Count
Before we look at some popular software development metrics, it’s important to remember that they are only really useful if they are linked to specific business goals and deliver actionable insight. Traditional source code metrics such as KLOC (thousands of lines of code) and cyclomatic complexity might provide interesting data points but in themselves won’t give you a clear indication of productivity or quality. And they won’t have a positive impact on the software development environment if the team doesn’t know how they fit into wider business objectives.
So you need to be measuring the right things and then using the information in the right way to optimize performance. Where possible, you should also involve the whole team in measuring performance to avoid damaging morale and align everyone behind what you aim to achieve together. Another thing to keep in mind is finding the right balance between using performance metrics to improve business value and not restricting developer creativity or using up too much time that could be better spent on the actual project at hand.
Keeping these caveats in mind, here are some key performance metrics that cover different aspects of software development. If used correctly, they may help your team consistently deliver software projects that meet or exceed client expectations.
12 Key Performance Metrics
Agile/Productivity Metrics
These can be used to measure how productive a developer team is and identify any problems that may be affecting workflow. They generally give an indication of how long it takes a team to turn a software idea into a working reality. If any of these metrics throw up a ‘red flag’, try not to assume a cause or assign blame without first consulting the team. The best fix will be one that everyone agrees is necessary.
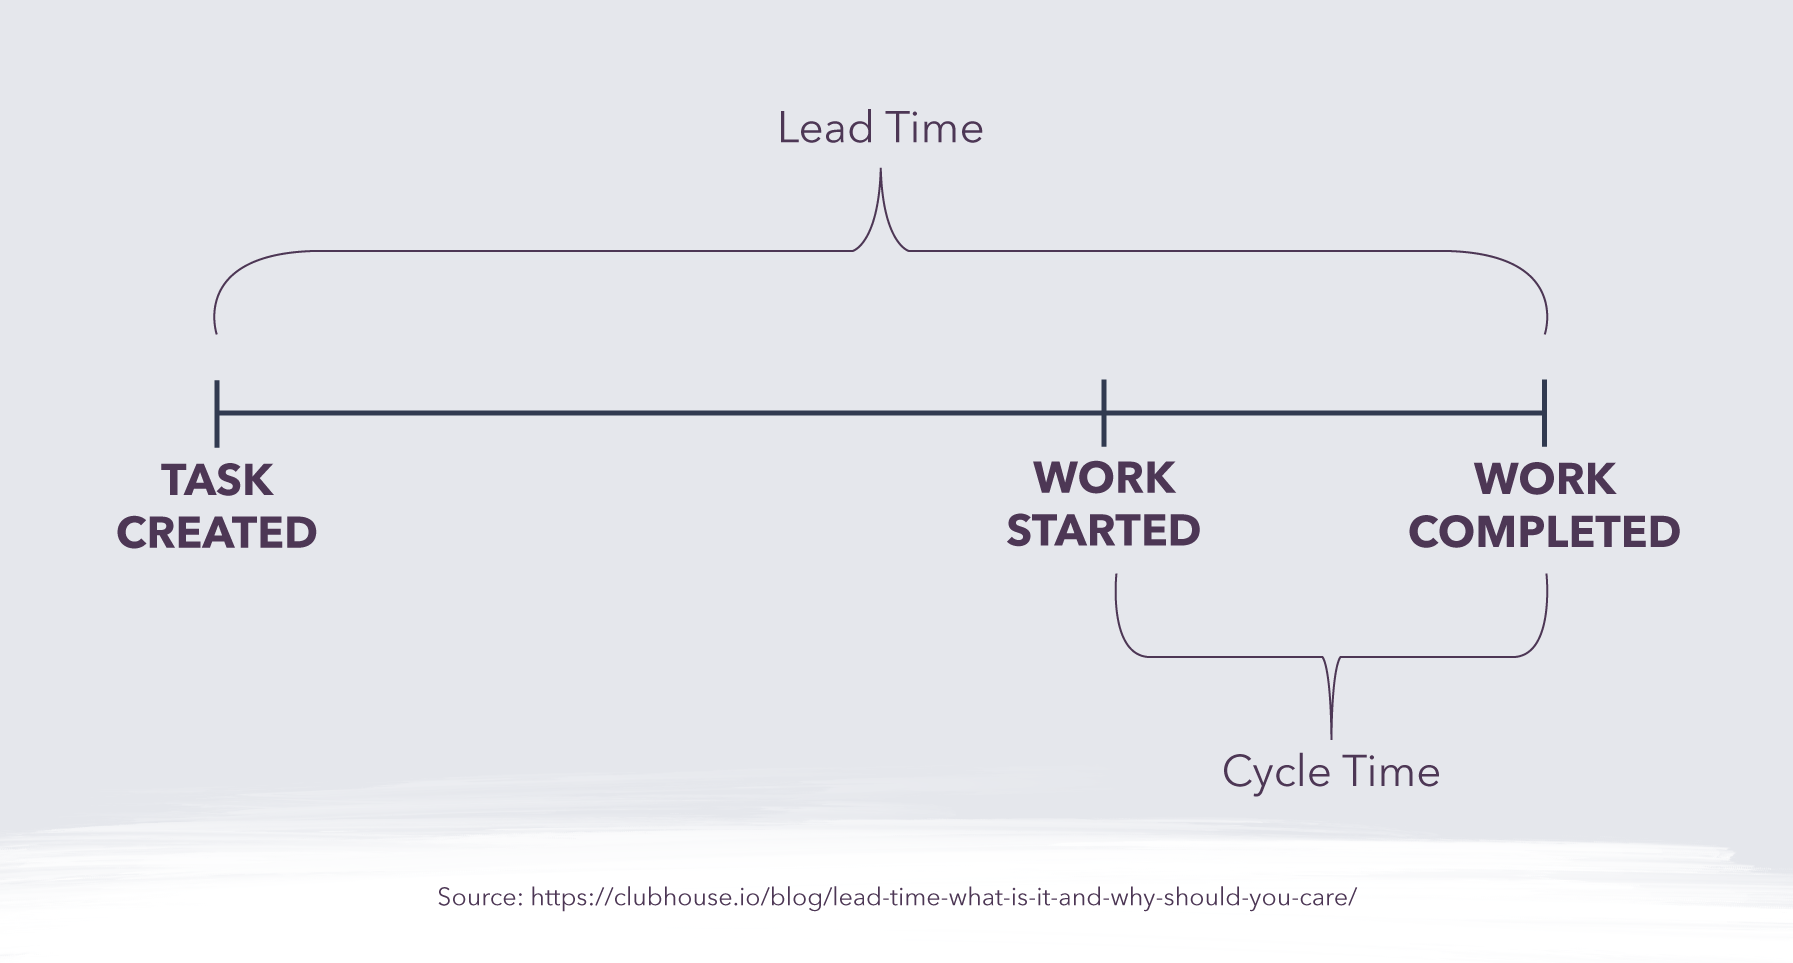
- Lead Time: This measures how long it takes for your software project to go from creation to completion. It is typically considered a metric from the user or client’s perspective - the time they wait between requesting a product or service and it is delivered. Usually, you want this to be as low as possible to reduce client wait time, though obviously, this shouldn’t come at the expense of product quality.
- Cycle Time: This is sometimes confused with lead time, but the key difference is that cycle time only measures how long a task/project takes once work has started on it. Consider an example of ordering takeout: lead time measures how much time passes between the customer making an order and receiving the food, while cycle time would calculate how long it took the chef to prepare the order, or the driver to deliver the food. Cycle times can help identify where there may be bottlenecks in the production workflow.
- Velocity: This is a measure of how many ‘units’ of work a development team can complete in a set period of time (a ‘sprint’). Over time, an average velocity can be used as an estimate for how productive a team is likely to be on a single ‘sprint’, offering a benchmark against which performance can be measured. If a team’s velocity varies wildly from the average, there may be something disrupting the process that can be investigated and fixed (if required). Note that velocity may not be useful to compare performance across different teams given unequal circumstances, targets, and objectives.
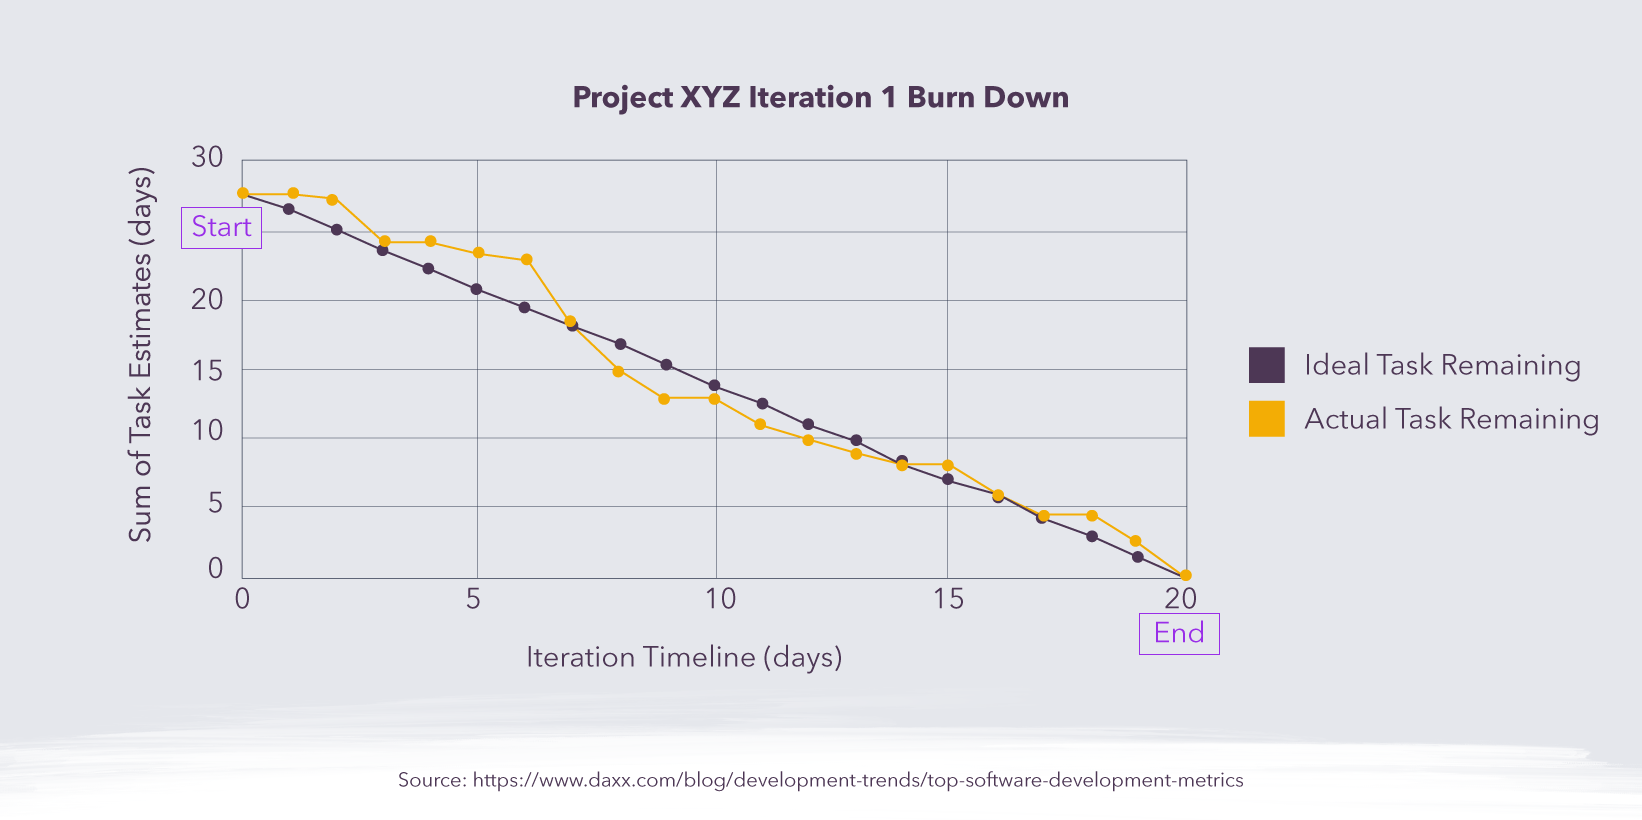
- Sprint Burndown: This is closely linked to velocity and is usually drawn as a chart that shows the rate at which tasks are being completed and how much work is still to be done. It can help project managers track whether a sprint is running to schedule and implement quick fixes when something is going wrong. The burndown will also provide valuable information to help improve scheduling for future sprints.
Software Quality Metrics
These metrics are focused on the performance of the software itself, rather than the developer team. In most cases, the data these metrics provide needs to be contextualized to make sense and be useful in driving positive change. This is particularly important when weighing up the cost of certain software errors versus the cost of fixing them.
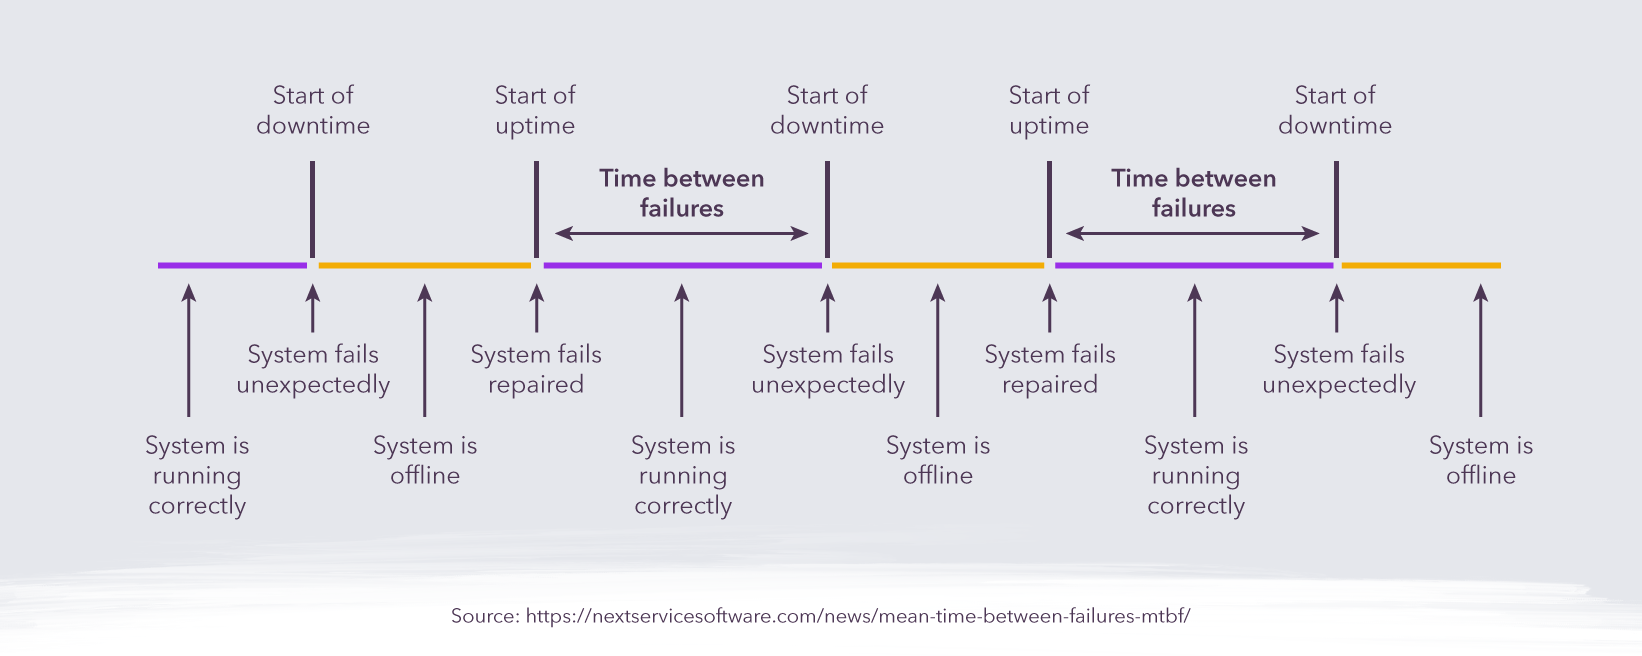
- Mean Time Between Failures (MTBF): As the name implies, this metric is used to assess the time between software errors or failures. Obviously the longer the better here, as this indicates that the software is working correctly.
- Mean Time To Recover (MTTR): Ideally, our software products would never fail, but that’s not realistic. So it’s just as important to know how quickly things can be set right when they do go wrong. This can be complemented with a ‘Mean Time To Detect’ metric that shows how long it takes a team to notice a bug or issue and how quickly it reacts to an unexpected problem.
- Application Crash Rate: This measures how often an application fails relative to the number of times it is used. If the number is small, or falling, then things are heading in the right direction. There may even be an acceptable low-level crash rate if the MTBF is long and the MTTR short, but that will depend on the impact that each crash has on the organization’s bottom line.
- Escaped Defects: This calculates how many software problems - or the proportion of overall defects - that were only detected after the product had been released. When a high number of errors are discovered by end-users, it may signal a problem with the QA and testing environment.
Security Metrics
This is another important aspect to monitor as security breaches can cause huge financial and reputational damage to an organization.
- Endpoint Incidents: This simply counts the number of devices that were affected by a security problem such as a virus. It is an important starting point when a cyberattack occurs to assess how widespread the damage is and start to investigate how and where the problem started. It can be used to improve the design of software systems to mitigate damage in future attacks.
- Mean Time to Repair (MTTR): This can be used to determine how long it takes a team on average to detect, contain and repair a security problem. If the number falls over time, then the team is becoming more effective at responding to breaches.
End-User Metrics
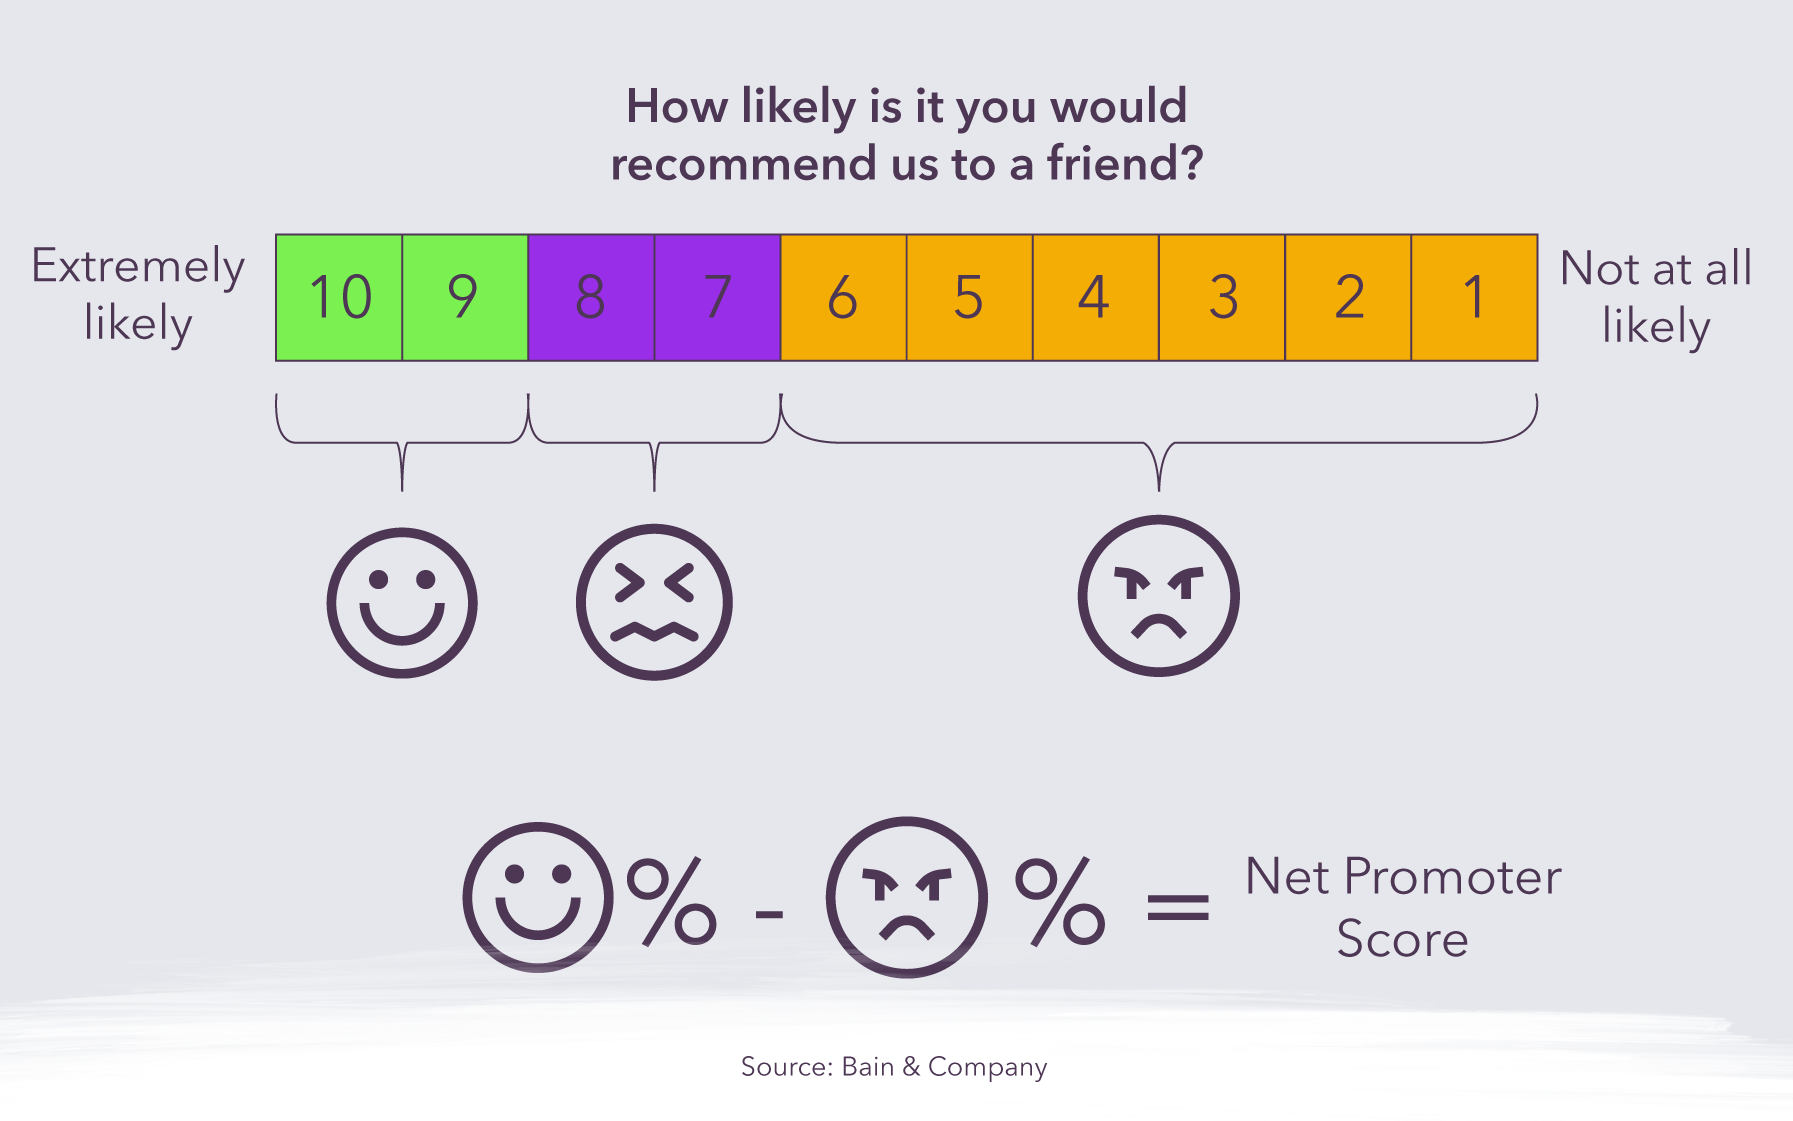
These metrics are used to gauge customer satisfaction with the software product. This is a challenge given the subjective nature of user experiences and difficulties in getting customers to engage, but it can offer important guidance about whether the software is meeting expectations or falling short.- Net Promoter Score (NPS): This measures how willing a customer is to recommend your products/services to others. It is an indication of how loyal your end users are, which is key to developing long-term relationships.
- Customer Satisfaction Score (CSAT): This is another metric that relies on end users providing honest information and is highly subjective. In any case, the goal here is obviously to achieve the highest score possible and see that rise over time.
Interested in hiring talented Latin American developers to add capacity to your team? Contact Jobsity: the nearshore staff augmentation choice for U.S. companies.


Santiago Mino, VP of Strategy at Jobsity, has been working in Business Development for several years now helping companies and institutions achieve their goals. He holds a degree in Industrial Design, with an extensive and diverse background. Now he spearheads the sales department for Jobsity in the Greater Denver Area.